Linear regression is one of the first algorithms students come across when doing machine learning. It is super simple to implement and is powerful in functionality, and is, therefore, a skill you need for your assignments.
However, for homework, simply running the code is not enough. The professors expect you to understand the theory, create neat code, and explain the results – sometimes in APA style.
This article covers all three elements, leaving your assignment looking professional and likely to earn you full marks.
Still, if you face difficulties in understanding these, you may not know the proper ways or strategies for it. In such situations, one can seek assistance from CodingZap experts for computer science homework help.
TL;DRÂ
Topic | Summary |
Theory | Linear regression predicts a continuous target variable with predictors; it involves a simple linear regression with the equation:Â |
Assumptions | Major checks: linearity; independence of errors; heteroscedasticity; normality of residuals; and no multicollinearity. |
APA-Style Write-Up | Report the regression equation (specification) of interest, F-statistic, p-value, R², and then interpret the coefficients in words. |
Residual Plots | Use scatter residuals versus predictions, histograms, and Q-Q plots to check the assumptions graphically. |
Common Mistakes | Not checking for assumptions; Not interpreting the coefficients; Not doing the residual plots; Copying and pasting the output and presenting it as is; Confusing correlation with causation; Overfitting; APA style formatting is below par. |
Final Tips | Explain every step, show appropriate plots, formatted results, and clean and readable code. |
The Theory of Linear Regression
The essence of linear regression is predicting a continuous target variable based on one or more predictors. Linear regression fits a straight line (in multiple dimensions, this would be a plane) that best describes the relationship between predictors, x, and the target, y.
The simple linear regression equation:Â
y = β0​+β1​x+ϵ
Where:Â
𝑦 = dependent variable (target)Â
𝑥 = independent variable (predictor)Â
đť›˝0 = interceptÂ
đť›˝1 = slope (the effect of 𝑥 on 𝑦 )Â
đťś– = error term
Why Assumptions are Important? Read Below
Linear regression is only reliable when some conditions are satisfied. Violating those assumptions may lead to unreliable predictions and conclusions.
Professors sometimes want students to show that they checked these before implementing the model.
Assumption 1: LinearityÂ
The relationship between predictors and the target should be linear.
You can assess these linear relationships with scatterplots or residual plots.Â
Assumption 2: Independence of ErrorsÂ
Residuals (errors) must be independent from one another.Â
This assumption can easily be violated with time-series data.
Assumption 3: HomoscedasticityÂ
The residuals should have a consistent spread across all predicted values.Â
If residuals “fan out,” that is heteroscedasticity.
Assumption 4: Normality of ErrorsÂ
The residuals must follow a normal distribution.Â
You can verify this with a histogram or a Q-Q plot.Â
Assumption 5: No MulticollinearityÂ
In the case of multiple regression, the predictors should not be too correlated with one another. This high correlation will inflate the standard errors and reduce reliability.
An APA Style Write-up for your assignment
APA-style write-ups lend a professionalism to assignments. You may want to present the results of this study as follows:Â
First, write your APA citation for the article from which the data were taken. A simple linear regression was performed to predict exam scores from hours studied.Â
There was a significant positive regression relationship between exam scores and hours studied, F(1,8)=91.2, 𝑝<.001, and the regression equation was as follows:Â
Exam Score = 30.5 + 6.2 x Hours Studied
This means that for each extra hour studied, you can expect an average increase in the predicted score of 6.2 points.Â
You should also include the following in APA format:Â
– Regression equation
– F-statistic and p-value
– R² value
– Discussion of the
Lets walk through Residual Plots
It is not just for fun; residual plots can help you check the assumptions visually.
Residual vs Predicted PlotÂ
This plot shows the residuals scattered around zero. The residuals are random with no distinct pattern. Shows assumptions of linearity and constant variance won’t be violated.
Histogram of ResidualsÂ
The residuals appear to be bell-shaped. This suggests the errors are approximately normally distributed, which is how linear regression analysis is presented.Â
Should show a bell-shaped curve if residuals are normally distributed.
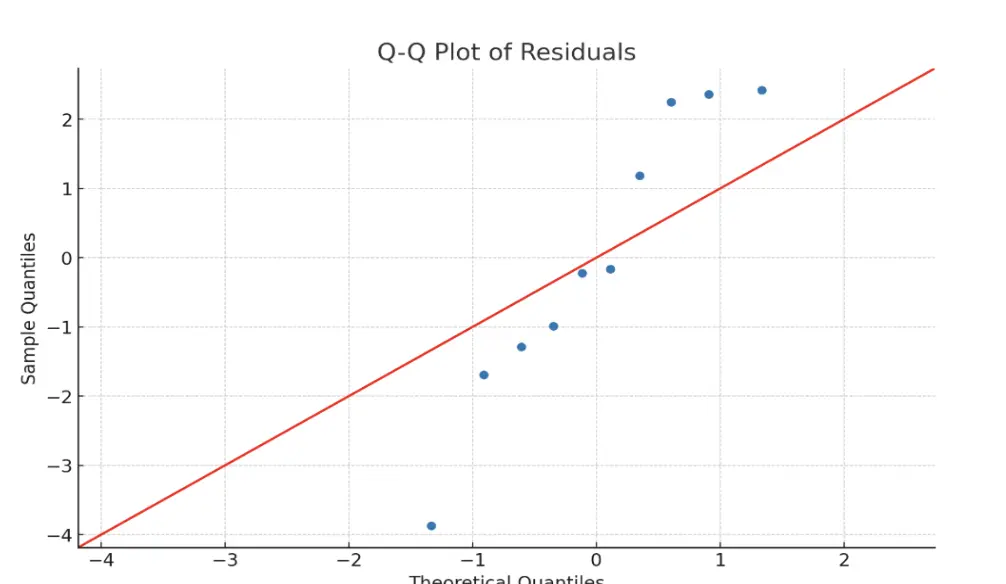
Q-Q PlotÂ
The points generally follow the diagonal line. This provides further evidence that the residuals are consistent with a normal distribution and thus fortifies your confidence in using your model as valid.
What Are Common Student Errors?
Jumping to conclusions
Many students are eager to get to the model and do not think or test for linearity, Independence, or residuals. So it starts with weak results.Â
Only reporting numbers
It is not enough to report the slope or R². Always justify their potential meaning in the real world.Â
Not reporting residuals
Residual plots present evidence of your model fit and validity. If you do not include them, your homework will appear incomplete.
Copy-pasting the raw output
Professors do not want to see a column of Python numbers. They want to see your explanation of what those results mean.Â
Confusing correlation and causation
This is a classic mistake; while two things might move together, it does not imply one is causing the other, therefore, this error diminishes the trust of your work.Â
Too many predictors
In the case of multiple regression, using every variable you can find often results in superfluous evidence for validity. The best direction is a model that is simpler and builds trust.
Poor formatting
Even if you present a good analysis, you might lose marks for simply not writing the results in APA style or putting your results into a nice report.
Final Tips for everyone's submissions
- Check assumptions before you start interpreting things.
- Provide visual support for each assumption check, including scatterplots, histograms, and residual plots.
- Report results in APA style to report results professionally.
- When reporting the coefficients, explain them in real-world terms.
- Be sure your code is clean and neat with comments.
Conclusion
Linear regression assignments involve more than .fit() and printing the result.Â
If you understand the theory and assumptions, and present your results clearly, you will be ahead of your peers in your submissions.
Your professor not only grades your outcome, but they are grading your process as well!
If you can show them you understand all the steps of that process, those high marks will follow!


